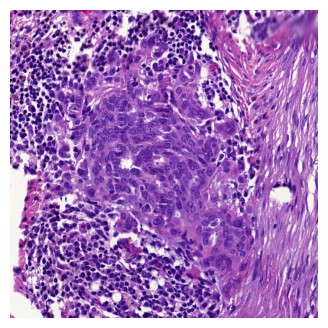
A 1500x1500 H&E image of HGSC containing a tumor nest.
Note
Pairs with:
hgsc_cancer_nuclei()hgsc_cancer_inst_mask()hgsc_cancer_type_mask()
Examples:
>>> import matplotlib.pyplot as plt
>>> from histolytics.data import hgsc_cancer_he
>>> fig, ax = plt.subplots(figsize=(4, 4))
>>> im = hgsc_cancer_he()
>>> ax.imshow(im)
>>> ax.set_axis_off()

Source code in src/histolytics/data/fetch.py
| def hgsc_cancer_he():
"""A 1500x1500 H&E image of HGSC containing a tumor nest.
Note:
Pairs with:
- `hgsc_cancer_nuclei()`
- `hgsc_cancer_inst_mask()`
- `hgsc_cancer_type_mask()`
Examples:
>>> import matplotlib.pyplot as plt
>>> from histolytics.data import hgsc_cancer_he
>>> fig, ax = plt.subplots(figsize=(4, 4))
>>> im = hgsc_cancer_he()
>>> ax.imshow(im)
>>> ax.set_axis_off()
"""
return FileHandler.read_img(BASE_PATH / "hgsc_nest.jpg")
|