gdf2inst
gdf2inst 
gdf2inst(
    gdf: GeoDataFrame,
    xoff: int = 0,
    yoff: int = 0,
    width: int | None = None,
    height: int | None = None,
    reset_index: bool = False,
    id_col: str | None = None,
    transform: Affine | None = None,
) -> np.ndarray
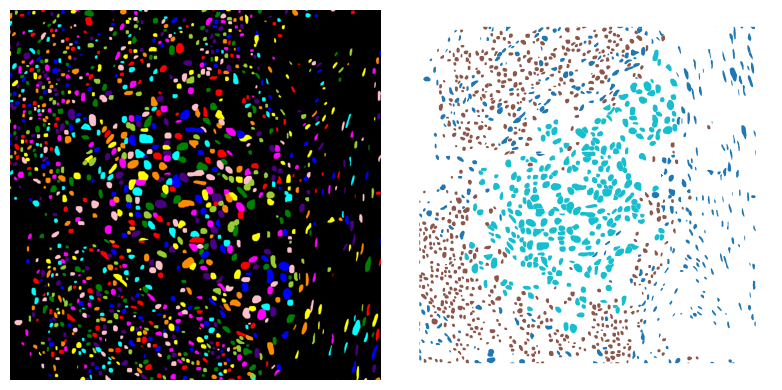
Rasterize instance geometry onto a discrete integer grid.
Parameters:
| Name | Type | Description | Default |
|---|---|---|---|
gdf
|
GeoDataFrame
|
Instance geometries in the output grid's coordinate units. |
required |
xoff
|
int
|
Unit-grid x origin when |
0
|
yoff
|
int
|
Unit-grid y origin when |
0
|
width
|
int | None
|
Output columns. Inferred from geometry bounds only on the unit grid. |
None
|
height
|
int | None
|
Output rows. Inferred from geometry bounds only on the unit grid. |
None
|
reset_index
|
bool
|
Assign IDs 1 through N instead of retaining existing IDs. |
False
|
id_col
|
str | None
|
Column providing instance IDs; defaults to the frame index and is
ignored when |
None
|
transform
|
Affine | None
|
Rasterio affine mapping (column, row) pixel corners to geometry coordinates. Requires explicit width/height and zero xoff/yoff. Geometry and transform must use the same units; no CRS conversion occurs. |
None
|
Returns:
| Type | Description |
|---|---|
ndarray
|
Int32 instance labels with shape (height, width), background zero, and |
ndarray
|
Rasterio's existing pixel-center/edge burning rules. IDs are not interpolated. |
Raises:
| Type | Description |
|---|---|
ValueError
|
If an explicit grid lacks dimensions or also supplies offsets. |
TypeError
|
If empty geometry has no unit-grid output dimensions. |
Examples:
>>> from histolytics.data import hgsc_cancer_nuclei
>>> from histolytics.utils.raster import gdf2inst
>>> from skimage.measure import label
>>> from skimage.color import label2rgb
>>> import matplotlib.pyplot as plt
>>>
>>> nuc = hgsc_cancer_nuclei()
>>> # Convert the GeoDataFrame to an instance segmentation raster
>>> nuc_raster = gdf2inst(nuc, xoff=0, yoff=0, width=1500, height=1500)
>>> # Visualize the instance segmentation raster and the GeoDataFrame
>>> fig, ax = plt.subplots(1, 2, figsize=(8, 4))
>>> ax[0].imshow(label2rgb(label(nuc_raster), bg_label=0))
>>> ax[0].set_axis_off()
>>> nuc.plot(column="class_name", ax=ax[1])
>>> ax[1].set_axis_off()
>>> fig.tight_layout()
Source code in src/histolytics/utils/raster.py
220 221 222 223 224 225 226 227 228 229 230 231 232 233 234 235 236 237 238 239 240 241 242 243 244 245 246 247 248 249 250 251 252 253 254 255 256 257 258 259 260 261 262 263 264 265 266 267 268 269 270 271 272 273 274 275 276 277 278 279 280 281 282 283 284 285 286 287 288 289 290 291 292 293 294 295 296 297 298 299 300 301 302 303 304 305 306 307 308 309 310 311 312 313 314 315 316 317 318 319 320 321 322 | |